By Jason
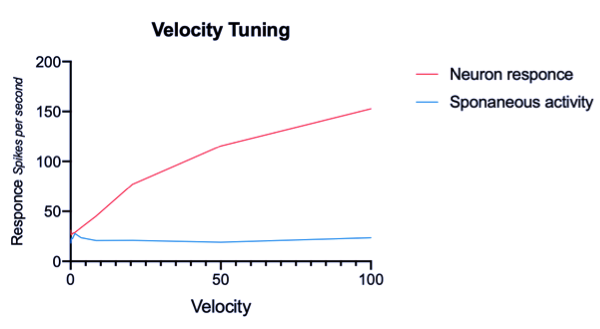
For me, data analysis can be rather daunting – especially when it involves coding. However, it is one of the reasons why I chose to do my honours in this lab. Over 20 years ago I studied a semester of Mathematics and the word ‘Matlab’ has haunted me ever since; although, I have always known it’s a very useful tool. To investigate the 3D optic flow sensitive descending neurons response to roll, we decided to velocity tune the neurons as an initial experiment.
Now I have my data – what to do with it?
So far, I have some results for an excitatory response, in spikes per second, as a result of varying roll velocities. This may not look like much, but for this 40..something…year old student I’m rather chuffed to say the least.
This is just the beginning of my Labchart, Matlab and Prism (graph pad) experience – I will keep you posted as I fumble through the next few months. So, keep your eye out for some progress ;-).
 RSS Feed
